Algorand Price Prediction for Today, March 22: ALGO/USD Faces the North as Price Touches $0.24 Level
The Algorand price prediction shows that ALGO could be ready for the uptrend, and it may fundamentally break above $0.25 respectively.
Algorand Prediction Statistics Data:
- Algorand price now – $0.23
- Algorand market cap – $1.6 billion
- Algorand circulating supply – 7.1 billion
- Algorand total supply – 7.3 billion
- Algorand Coinmarketcap ranking – #37
ALGO/USD Market
Key Levels:
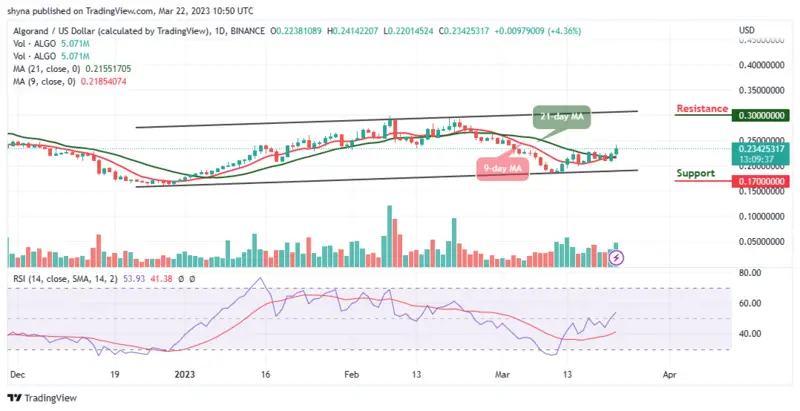
Resistance levels: $0.30, $0.32, $0.34
Support levels: $0.17, $0.15, $0.13

ALGO/USD is crossing above the 9-day and 21-day moving averages to increase the bullish movement. Meanwhile, the cryptocurrency might kick-start another bullish run above $0.28 if the market price moves toward the upper boundary of the channel. Meanwhile, any positive break above the resistance level of $0.25 is the first signal needed for the buyers to press higher. Nevertheless, ALGO/USD has to break to the upside before hitting the $0.28 resistance level.
Algorand Price Prediction: Algorand (ALGO) Trades Positively
The Algorand price is currently hovering above the 9-day and 21-day moving averages. If the buyers begin to grind higher, the first resistance level may come at $0.26 as this could also be followed by $0.28. However, additional resistance levels can then be found at $0.30, $0.32, and $0.34. On the other side, if the Algorand price slides and heads towards the lower boundary of the channel, it could hit the first support level at $0.20.
However, crossing below the lower boundary of the channel may lead to the critical support levels at $0.17, $0.15, and $0.13 respectively. The technical indicator Relative Strength Index (14) is above the 50-level, which indicates that buyers may begin to gain control of the market, and this could also mean that another signal of ALGO could be pushing towards the resistance level of $0.25 soon.
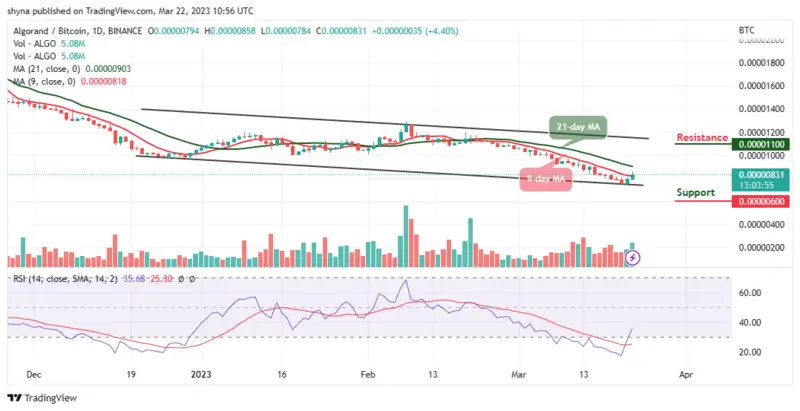
Against Bitcoin, the daily chart shows that the Algorand price is attempting to cross above the 9-day moving average. As soon as the price stables above this barrier, there is a possibility that additional gains could be obtained. Therefore, the next resistance level is close to the 1000 SAT level. If the price keeps rising, it could even break the 1100 SAT and above.

However, if the bears regroup and slide below the lower boundary of the channel, 700 SAT support may play out before rolling to the critical support at 600 SAT and below. Meanwhile, the Relative Strength Index (14) is moving to cross above the 40-level, suggesting bullish movement.
Alternatives to Algorand
Looking at the daily chart, the Algorand bulls are now coming back into the market. Therefore, if the buyers can put more effort and push the market price towards the upper boundary of the channel, the coin can create additional gains in next positive direction. Nevertheless, while some of the top meme tokens have offered huge returns in the past, they often lack any real utility. Love Hate Inu positions itself as a meme cryptocurrency that offers actual use cases and rewards to its users. However, Love Hate Inu’s LHINU token is currently available to buy during the first round of its presale as almost $2m has been raised so far.
Comments
Post a Comment